Page last modified on : 07/Dec/2018
Data Analytics Reports
1.TRADE CONCENTRATION & SIMILARITY INDEX-
The comparative advantage possessed by a country in respect of producing a set of commodities helps the country to engage in export of those commodities. In general once these comparative advantages are translated in having specialization of production of specific commodities based on cheap availability of corresponding factor resources these tend to determine the composition of the export basket of the country. The Trade concentration Index attempts to measure the concentration level observed in basket of traded commodities. Thus a high value of trade concentration index would indicate the scenario of few commodities dominating the set of traded commodities whereas a low value of trade concentration index would signal to a diversified trade basket.
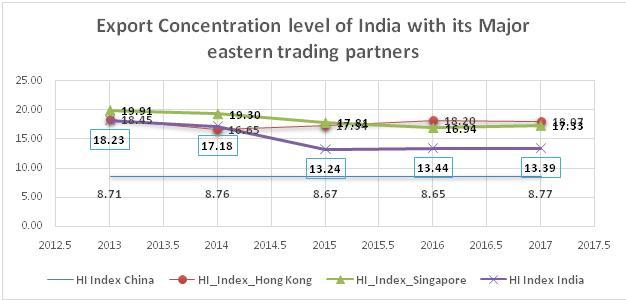
The country specific trade concentration indices of India and its major trading partner reveal that in comparison to its major eastern trading partners India’s export concentration has shown a declining trend with the only exception of China P RP which all through has maintained a more diversified export basket compared to India.

Similar comparison with India’s western major trading partners shows that apart from United Arab Emirates, all the major trading partner has low export concentration index with Germany being the lowest.
Export Concentration Index at Bilateral level-
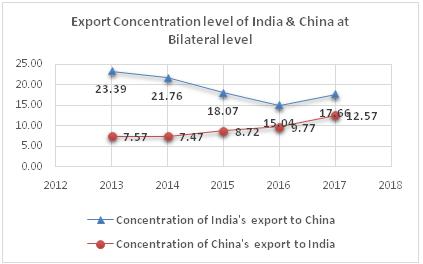
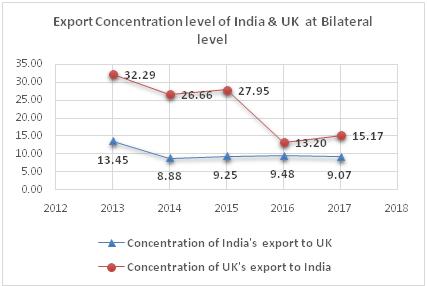
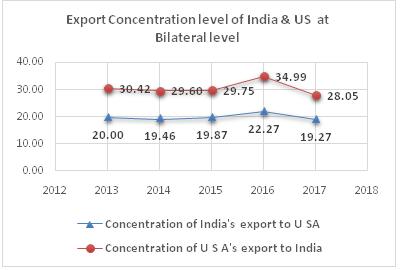
The concentration level of the export basket at the bilateral level throws up some valuable insights in nature of the bilateral trade. As for India’s bilateral export concentration with its major trading partners it is noticed that in bilateral trade with USA, UK and U A E, India’s export concentration is much lower compared to these trade partners which indicates that India exports a varied set of commodities to these countries as compared to corresponding imports from these countries. Again in respect of China P RP, Hong Kong, India has exhibited a higher concentration compared to these trading partners though in case of China P RP the difference in export concentration has narrowed down. India’s bilateral export concentration with Germany has shown a marked shift since 2016 wherein Germany has shown a more diversified export portfolio compared to India.
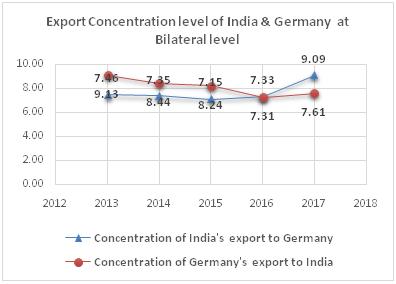
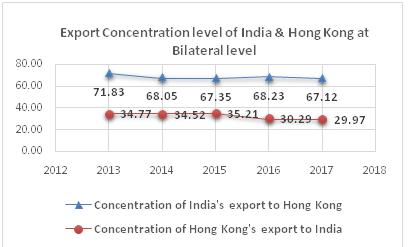
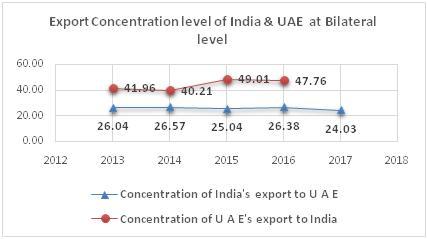
Export Similarity Index-
The export similarity Index between two countries measures the extent of resemblance of export basket of the countries. The export similarity index values of India with its major trading partners reveal that in respect of commodities exported India’s export basket is not very similar to its major trading partners.

2.TRADE COMPLEMENTARITY AND INTENSITY-
Trade arises when two countries have a complementarity of needs – what one country has to sell is needed by the other country and vice versa. When two countries come to the world market with the same basket of exports and the same set of needs, there is little possibility of trade between them. The extent of complementarity of needs is measured by the Trade Complementarity Index (TCI). This is explained in Methodology. It is expected that higher the TCI, the higher will be the trade between two countries.
Tables 4A and 4B show the countries with which India has the highest and lowest trade complementarities, respectively (The ranking is done as per 2016 data).
TABLE 4A
|
Country
|
2013
|
2014
|
2015
|
2016
|
|
Togo
|
0.5244
|
0.5335
|
0.4782
|
0.4885
|
|
Ecuador
|
0.4106
|
0.4067
|
0.3716
|
0.4741
|
|
Seychelles
|
0.3295
|
0.3247
|
0.3211
|
0.4726
|
|
Central African Rep.
|
0.4785
|
0.4957
|
0.4752
|
0.4621
|
|
Burkina Faso
|
0.5458
|
0.5375
|
0.4643
|
0.4590
|
|
Samoa
|
0.3585
|
0.3459
|
0.3651
|
0.4565
|
|
Madagascar
|
0.4859
|
0.4683
|
0.3909
|
0.4550
|
|
Cyprus
|
0.4857
|
0.4828
|
0.4275
|
0.4523
|
|
Greece
|
0.3226
|
0.3358
|
0.4510
|
0.4482
|
|
Algeria
|
0.3871
|
0.3369
|
0.3743
|
0.4467
|
|
Pakistan
|
0.4245
|
0.4448
|
0.4347
|
0.4442
|
|
Guyana
|
0.5246
|
0.5028
|
0.4256
|
0.4435
|
|
Oman
|
0.3030
|
0.3187
|
0.3654
|
0.4416
|
|
Benin
|
0.4458
|
0.4428
|
0.4332
|
0.4389
|
|
Bahrain
|
0.2117
|
0.2464
|
0.4065
|
0.4380
|
|
Argentina
|
0.3657
|
0.3782
|
0.3828
|
0.4361
|
|
Fiji
|
0.3506
|
0.3547
|
0.3822
|
0.4316
|
|
Uganda
|
0.4629
|
0.4707
|
0.4234
|
0.4316
|
|
Senegal
|
0.4850
|
0.4670
|
0.4226
|
0.4301
|
|
Belarus
|
0.3095
|
0.3061
|
0.4229
|
0.4288
|
TABLE 4B
|
Country
|
2013
|
2014
|
2015
|
2016
|
|
China, Hong Kong SAR
|
0.2378
|
0.2433
|
0.2482
|
0.2435
|
|
China
|
0.2156
|
0.2040
|
0.2730
|
0.2627
|
|
Slovakia
|
0.2402
|
0.2525
|
0.2829
|
0.2851
|
|
Botswana
|
0.3685
|
0.3422
|
0.3149
|
0.2895
|
|
Hungary
|
0.2714
|
0.2659
|
0.2921
|
0.2931
|
|
United Arab Emirates
|
0.3361
|
0.3371
|
0.2934
|
0.2947
|
|
Czechia
|
0.2666
|
0.272
|
0.2882
|
0.2959
|
|
Mexico
|
0.3164
|
0.3019
|
0.3057
|
0.2986
|
|
Luxembourg
|
0.3121
|
0.3093
|
0.3078
|
0.3051
|
|
Ireland
|
0.3245
|
0.3294
|
0.3159
|
0.3064
|
|
Panama
|
0.4302
|
0.4386
|
0.4027
|
0.3069
|
|
Kazakhstan
|
0.2789
|
0.3017
|
0.3237
|
0.3114
|
|
Namibia
|
0.3043
|
0.3116
|
0.3829
|
0.3137
|
|
Serbia
|
0.3029
|
0.2982
|
0.3293
|
0.3165
|
|
Norway
|
0.3053
|
0.3012
|
0.3172
|
0.3189
|
|
Other Asia, nes
|
0.2736
|
0.2665
|
0.3083
|
0.3304
|
|
Austria
|
0.3067
|
0.3116
|
0.3336
|
0.3319
|
|
Estonia
|
0.3546
|
0.3653
|
0.3558
|
0.3331
|
|
Switzerland
|
0.2775
|
0.3031
|
0.3358
|
0.3355
|
|
Dominican Rep.
|
0.3006
|
0.3126
|
0.3364
|
0.3429
|
From Tables 4A and 4B, a fact seems to emerge – India has the largest complementarities of trade with developing, and in many cases, backward economies. The smallest complementarities are with more developed countries generally. This points to the greater similarity of India’s export and import baskets with those of more developed countries than with those of more backward countries. This is a welcome sign, but there is a possibility that this may result in large trade flows with low-income economies. This can be averted if intra-sectoral complementarity with large markets can be increased. There is a voluminous automobile trade between Germany and Japan, both large and competent producers of the product, because there is a lot of complementarity among demand and supply of various types and qualities of automobiles manufactured by the two countries.
Whether India’s exports to a particular country are sufficiently high depends on the Trade Intensity Index between India and that country (explained in Methodology). Tables 4C and 4D show the countries with which India has the highest and lowest trade intensities, respectively (The ranking is done as per 2016 data).
TABLE 4C
|
Country
|
2013
|
2014
|
2015
|
2016
|
|
Sri Lanka
|
15.7565
|
19.6606
|
17.4192
|
14.9481
|
|
Uganda
|
8.7649
|
10.7045
|
13.0024
|
11.6249
|
|
United Rep. of Tanzania
|
15.8112
|
16.7532
|
10.0735
|
11.5981
|
|
Mauritius
|
10.8553
|
15.6284
|
10.4915
|
8.8569
|
|
United Arab Emirates
|
7.2149
|
7.4751
|
7.6447
|
8.8244
|
|
Maldives
|
6.0516
|
6.1698
|
7.2850
|
6.8659
|
|
Oman
|
6.2780
|
4.9989
|
4.6407
|
6.4697
|
|
Ethiopia
|
6.9737
|
4.5843
|
4.5472
|
5.4719
|
|
Benin
|
5.9805
|
3.5395
|
3.5333
|
5.2519
|
|
Niger
|
2.7136
|
1.7076
|
2.7437
|
4.9808
|
|
Rwanda
|
4.3215
|
7.0616
|
7.3071
|
4.5695
|
|
Senegal
|
2.6444
|
2.5743
|
3.6594
|
4.4313
|
|
Burkina Faso
|
1.9230
|
2.5698
|
2.5723
|
3.6565
|
|
Togo
|
2.1762
|
2.3593
|
2.3367
|
3.4152
|
|
Madagascar
|
4.4434
|
3.8340
|
3.6179
|
3.3988
|
|
Central African Rep.
|
1.3139
|
1.2597
|
1.5779
|
3.1582
|
|
Seychelles
|
2.9390
|
2.3079
|
1.7705
|
2.8119
|
|
South Africa
|
2.6799
|
3.0869
|
2.5294
|
2.7622
|
|
Bahrain
|
3.0013
|
2.0908
|
2.8680
|
2.7616
|
|
Israel
|
2.8499
|
2.5871
|
2.4804
|
2.7573
|
TABLE 4D
|
Country
|
2013
|
2014
|
2015
|
2016
|
|
Greenland
|
0.0721
|
0.0498
|
0.5305
|
0.000002
|
|
Luxembourg
|
0.0292
|
0.0231
|
0.0279
|
0.0298
|
|
Bermuda
|
0.0308
|
0.0591
|
0.0383
|
0.0802
|
|
Rep. of Moldova
|
0.0820
|
0.0777
|
0.0939
|
0.1004
|
|
Cabo Verde
|
0.0430
|
0.2264
|
0.0994
|
0.1099
|
|
Belarus
|
0.0850
|
0.0843
|
0.0886
|
0.1168
|
|
Slovakia
|
0.0987
|
0.1190
|
0.1490
|
0.1241
|
|
Bosnia Herzegovina
|
0.0476
|
0.0773
|
0.0990
|
0.1316
|
|
TFYR of Macedonia
|
0.0714
|
0.0788
|
0.0958
|
0.1391
|
|
Antigua and Barbuda
|
0.0664
|
0.0997
|
0.1211
|
0.1451
|
|
Austria
|
0.1441
|
0.1505
|
0.1649
|
0.1635
|
|
Serbia
|
0.1428
|
0.1193
|
0.1233
|
0.1657
|
|
Mongolia
|
0.1457
|
0.0918
|
0.1377
|
0.1922
|
|
Norway
|
0.1048
|
0.1085
|
0.3037
|
0.2005
|
|
Iceland
|
0.2053
|
0.1904
|
0.1854
|
0.2165
|
|
Romania
|
0.2829
|
0.3833
|
0.2675
|
0.2225
|
|
Czechia
|
0.1913
|
0.1921
|
0.2547
|
0.2530
|
|
Lithuania
|
0.2819
|
0.2781
|
0.2605
|
0.2542
|
|
Switzerland
|
0.2113
|
0.1682
|
0.1624
|
0.2558
|
|
Azerbaijan
|
0.3695
|
0.3869
|
0.2900
|
0.2652
|
Tables 4C does not have a single developed industrialized country on it, but Table 4D has quite a few. This is not entirely because of the trade complementarities.
It is expected that India will have high trade intensity with countries with which it has high trade complementarity. Whether this has really happened was checked by calculating Spearman’s Rank Correlation Index between TII and TCI of India with respect to 115 of its trading partners. The results are shown in Table 4E below.
TABLE 4E
|
Years
|
2013
|
2014
|
2015
|
2016
|
|
Rank Correlation Coefficient
|
0.1714
|
0.2372
|
0.3001
|
0.3905
|
Table 4E shows that the correlation is positive and increasing fast, but is still very low. This implies that there is still a lot of scope for better alignment of India’s exports to world demand and domestic supply conditions.
3. DETERMINATION OF POTENTIAL MARKETS USING RCA AND RCII-
Import of ITCHS Code: 621030 (Outer Garments for Women and Children) by the UK has been considered as our example.
RCII>1 indicates the UK imports the particular commodity proportionately more than the World imports.
RCA>1 suggests that India exports this particular commodity proportionately more than the World.
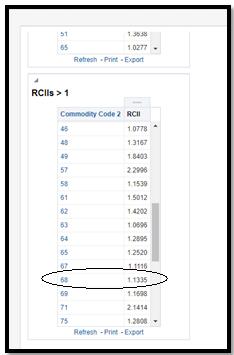
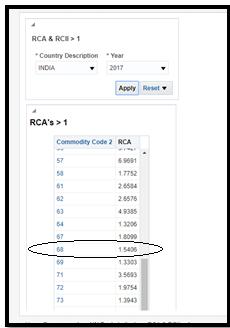
Four conditions are used to check the export potential of India to export Outer Garments for Women and Children to the UK.
These four conditions are:-
1.(xijk/xij) > or = (xik/xi) > (xk/xw)
Where xijk = India’s exports of k to partner country j and xij = India’s total exports to partner country j
2.(mijk/mij) > or = (mjk/mj) > (mk/mw)
where mijk = imports of commodity k by partner country j from India and mij = total imports of partner country from India.
3.(mijk/mjk) > or = (xik/xk) > (xi/xw)
4.(xijk/xik) > or = (mjk/mk) > (mj/mw)
a. If condition 1 fails, it means that in case of India’s exports to partner country j, the commodity k has not figured in as much important a way as it should have been. So, the problems may be identified, and exports increased after they are fixed.
b.If Condition 2 fails, it implies that in case of the partner country j’s imports of from India, the commodity k has not figured in as much important a way as it should have. Again, there is scope for increasing exports after identifying and removing the hurdle.
c.If Condition 3 fails, it means that the share of India in partner country j’s import market for commodity k is not as much as it should have been. Again, the reasons need to be found out. There is a prima facie case that exports can be increased once the bottlenecks are removed.
d.If Condition 4 fails, it means that partner country j’s importance as a destination for India’s exports of commodity k is not as much as it should have been. Again, there is a scope of improvement.
Thus, failure of any of the four conditions mentioned above indicates the possibility of improvement of exports for a particular country-commodity combination.
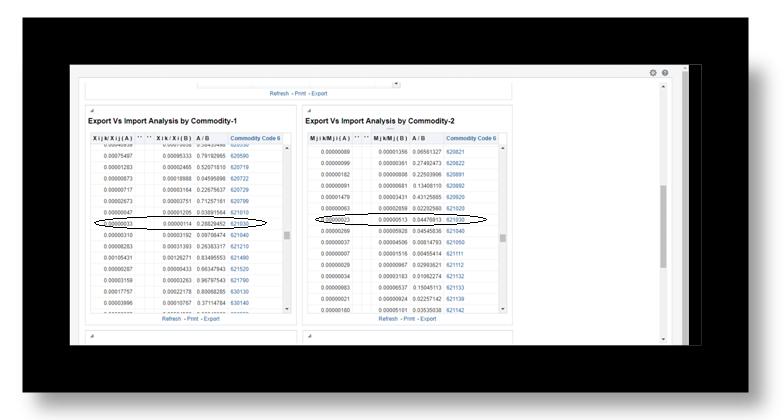
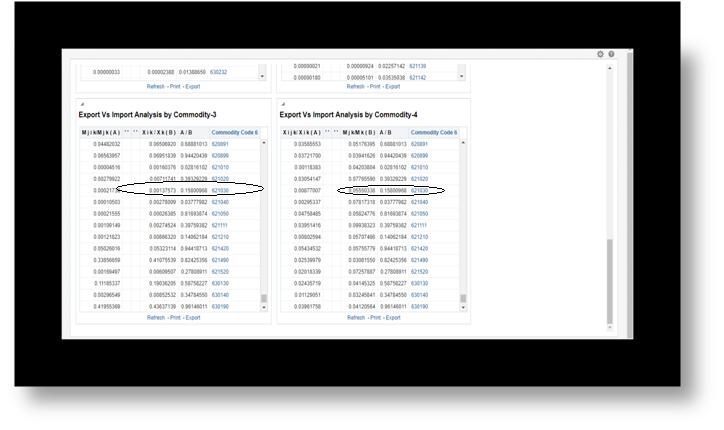
From the above calculations, it is observed that all the four conditions have failed, implying that India has a potential export market in the UK for this particular commodity. It is further observed that, in 2017, India ranked 19th in the list of Countries exporting this particular commodity to the UK.
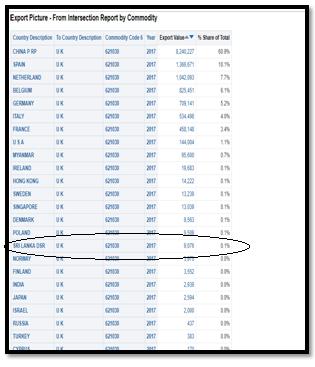
Thus it can be concluded that these four conditions, along with the calculation of RCA and RCII can be utilised to identify potential markets for any commodity.
Members of the Exporter-Imporeter community, policy makers,researchers and individuals from academin domain interested in studying and utilising the trade indicators cited above are requested to get registered with DGCIS Data Analytics Cell bu obtaining login credentilas for accessing the Analytics Tool developed for calculating these important trade indicators. Registration request can be sent through email to the id saikat.dgcis@nic.in.
Click here to access the Analytics Tool developed for calculating trade indicators.